Investigating Air, Heat, and Turbulence in City Corridors Microscale Urban Digital Twin
NSF NCAR is building a next-generation digital twin (DT) of urban environments—a deep learning system that recreates wind and heat flow between buildings at resolutions as fine as a few meters. This capability enables unprecedented insight into how air flows, heat accumulates, and turbulence forms within city corridors under a wide range of weather conditions.
The digital twin is trained using NSF NCAR’s FastEddy® large-eddy simulation model, a GPU-enabled system that can resolve sub-meter-scale atmospheric flow and surface–atmosphere exchanges across entire cities. We pair this physics-based foundation with advanced artificial intelligence. A diffusion-based model enhances regional-scale weather data down to neighborhood-scale detail by a factor of 32. A transformer-based AI model advances the high-resolution flow fields forward in time, predicting how urban winds and turbulence evolve. Regular assimilation of the high-resolution downscaled data maintains physical realism and sharp representation of meter-scale flow structures in the city.
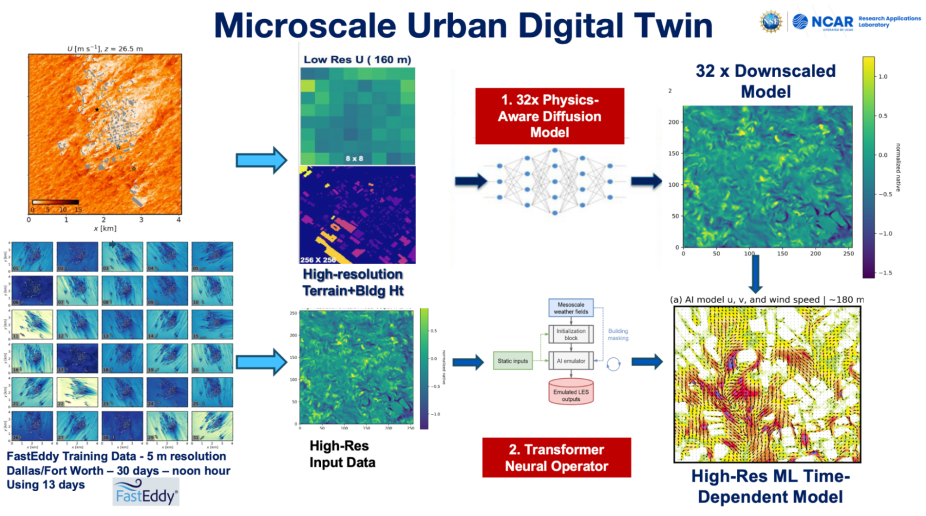
Figure: Summary of workflow of the Microscale Urban Digital Twin
The urban DT not only accurately models the flow statistics, but also captures the temporal evolution of turbulence around buildings. This AI model runs very fast, allowing ensemble simulations of urban flow. This DT may be useful for modeling urban heat-island effects and for assessing potential mitigation strategies. It will also contribute to studies of human health in urban environments; modeling the transport and dispersion of air contaminants, understanding turbulent flow characteristics for the use of unmanned aerial vehicles; and assessing impacts on surface transportation, emergency management, and building management.
Figure: Digital twin of flow in Dallas-Fort Worth for independent testing data. ML model results on the left and the FastEddy target data in the right panels. The top set of panels indicate wind speed (colors) and direction (arrows). The middle panels show density and the bottom panels indicate potential temperature. All variables are plotted at 180 m ASL, which is a level higher than some buildings, but still indicating flow about buildings as shown.
For more information or for partnership opportunities, please contact Sue Ellen Haupt.